Nielsen research found that 92% of consumers trust recommendations from friends and family above every other form of advertising, yet most home care agencies can’t trace which referral sources actually generate their admissions. That gap between trust and tracking is where lead flow dies.
TL;DR: Stalled leads in home care rarely stem from a single broken channel. A proper marketing funnel diagnostics process examines four layers: traffic volume, conversion rates, referral source health, and client retention. Fix the wrong layer and you waste months. This framework helps you find the right one.
Why Agencies Pivot Too Fast and Lose Data
The most common lead generation troubleshooting mistake is abandoning a strategy before it produces enough data to evaluate. According to HCMP’s lead generation system guide, many agency owners react to slow months by chasing short-term tactics like paid directories or social media pushes. Those efforts bring a few calls, then silence returns. The cycle repeats.
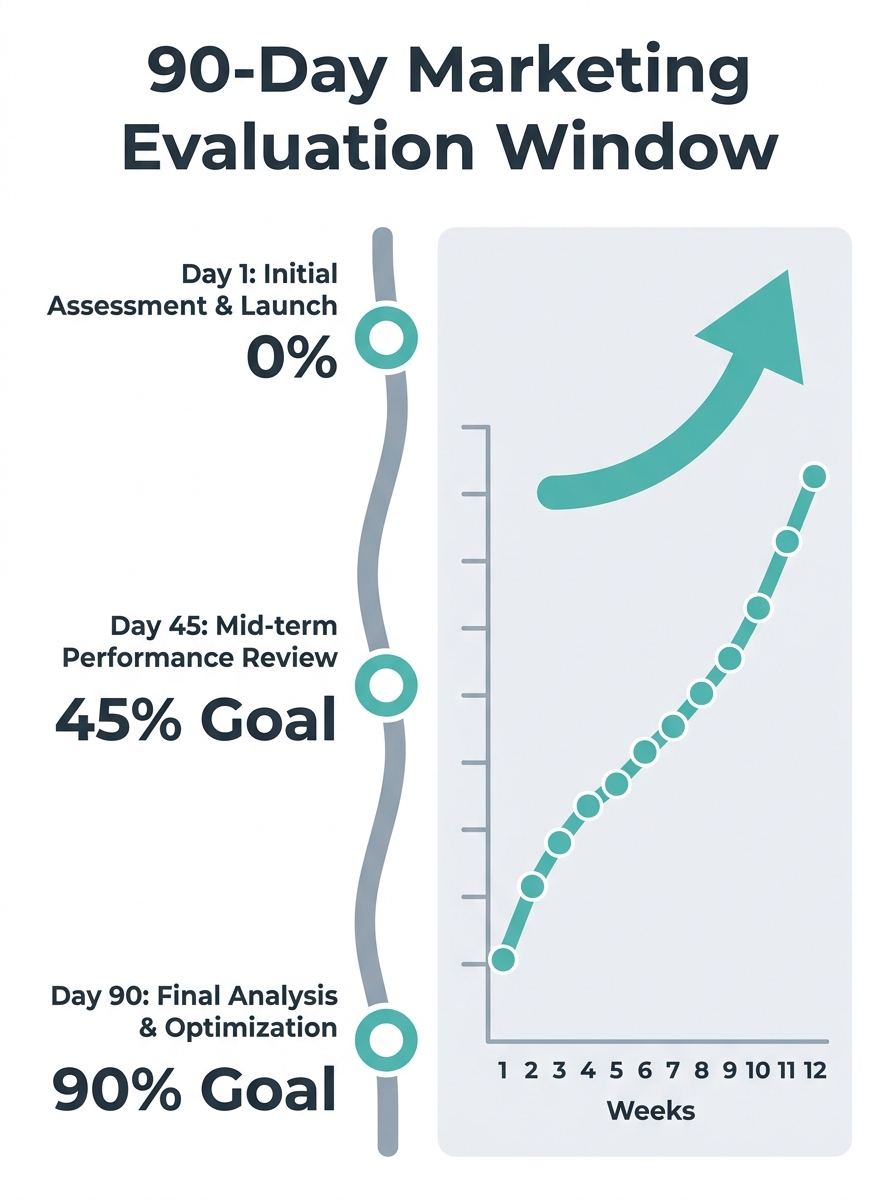
Search optimization and content marketing need 90 to 180 days to build real momentum. When you pivot at day 45, you restart the clock. You also destroy your ability to compare one quarter’s performance against the next. That comparison is the foundation of any honest home care marketing audit.
The fix is straightforward. Commit to a 90-day minimum window for any new channel before you evaluate its results. Track weekly inquiry counts during that window. If the trendline is flat after 90 days of consistent effort, you have real evidence to move on. If it’s climbing even slowly, you have a channel worth feeding.
The Four-Layer Diagnostic Model
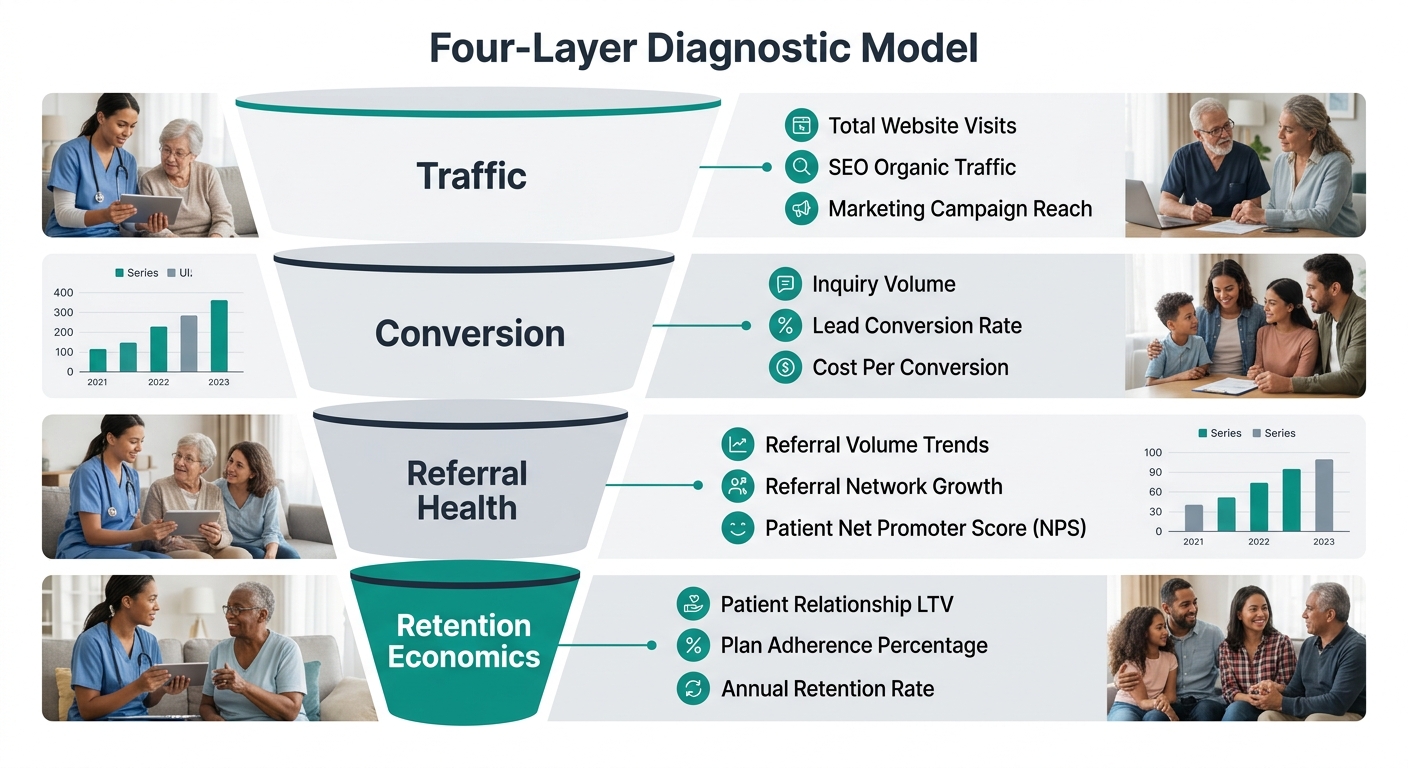
A useful home care marketing audit breaks into four layers. Problems at one layer look identical to problems at another from the outside. You see the same symptom (the phone stops ringing), but the causes differ, and so do the fixes.
Layer 1: Traffic. Are people finding you? Check your Google Business Profile views, website sessions by source, and ad impressions. If organic traffic dropped 20% or more over 60 days, you have a visibility problem. The schema markup checklist for senior care can reveal whether your technical SEO is costing you search real estate.
Layer 2: Conversion. Are visitors taking action? As CareBiz News reports, monitoring the percentage of inquiries that lead to consultations gives you a clear picture of funnel effectiveness. A healthy home care website converts 3% to 7% of visitors into phone calls or form fills. Below 2%, your landing pages or calls to action need work.
Layer 3: Referral health. Are your professional referral sources still sending? AxisCare’s referral tip sheet identifies six productive categories: past and current clients, hospital discharge planners, home health agencies, insurance providers, community networks, and strategic partnerships. If one of those six went quiet, your pipeline didn’t break everywhere. It broke in one specific place.
Layer 4: Retention economics. Are you losing clients faster than you gain them? When client churn outpaces new admissions, no amount of marketing spend closes the gap. Understanding total client lifetime value helps you evaluate whether your acquisition costs make sense, as CareBiz News’s metrics coverage notes.
Running a Referral Source Analysis That Reveals Real Problems
A study found that 34% of consumers chose their home care provider based on a recommendation from family or friends, per ShiftCare’s referral research. Another 22% cited other referral sources. Together, that’s 56% of new clients arriving through word-of-mouth or professional referral channels.
Those numbers make referral source analysis the highest-priority diagnostic for most agencies. Here’s what a real audit looks like:
- Pull 12 months of intake records and tag every new client by source: hospital discharge planner, physician office, home health agency, Area Agency on Aging, family or friend, online search, paid ad, or directory listing.
- Count monthly admissions per source. Flag any source that dropped by 30% or more in the last 90 days.
- Cross-reference each drop against your last contact with that referral partner. Did someone leave the hospital? Did a discharge planner retire? Did you stop visiting?
Agencies that maintain a referral source territory map catch these drops within weeks instead of months. The ones without a tracking system often don’t notice until revenue dips hard enough to trigger panic.
Fifty-six percent of home care clients arrive through referral channels. When your lead flow stalls, the referral layer is the first place to look.
If your analysis shows referral volume is stable but admissions are still down, the problem is elsewhere. Move to Layer 2 and audit your conversion path. Many agencies confuse a referral problem with a marketing decision-maker mismatch, where their messaging speaks to the wrong person in the family.
Agency Performance Metrics Worth Tracking Monthly
You can’t diagnose what you don’t measure. These agency performance metrics form the baseline for any marketing funnel diagnostics work:
| Metric | Healthy Range | Red Flag Threshold |
|---|---|---|
| Website conversion rate (visitor to inquiry) | 3% – 7% | Below 2% |
| Cost per lead (Google Ads) | $35 – $85 | Above $120 |
| Referral-to-admission rate | 40% – 60% | Below 25% |
| Inquiry-to-consultation rate | 50% – 70% | Below 35% |
| Client retention (6-month) | 75%+ | Below 60% |
| Google Business Profile actions/month | 150+ | Below 50 |
These ranges reflect benchmarks from private-duty home care agencies running Google Ads, as documented in HCMP’s PPC ROI calculator. Your local market will shift these numbers. A rural agency with 50 website visitors per month operates differently from a metro agency pulling 2,000 sessions. The point of tracking isn’t to hit someone else’s benchmark. The point is to spot your own trendline breaks.
ChoiceLocal’s home care marketing guide emphasizes that tools like Google Analytics, HubSpot, or a CRM can show where prospects drop off and which campaigns produce results. Ongoing performance analysis lets you refine your funnel and invest more in what works, rather than guessing.
And if your marketing automation platform isn’t connected to your CRM, you’re flying blind at Layers 1 and 2. Disconnected systems create gaps where leads enter the funnel but never get followed up on. That’s a system failure, not a marketing failure.
Where Paid and Organic Channels Break Differently
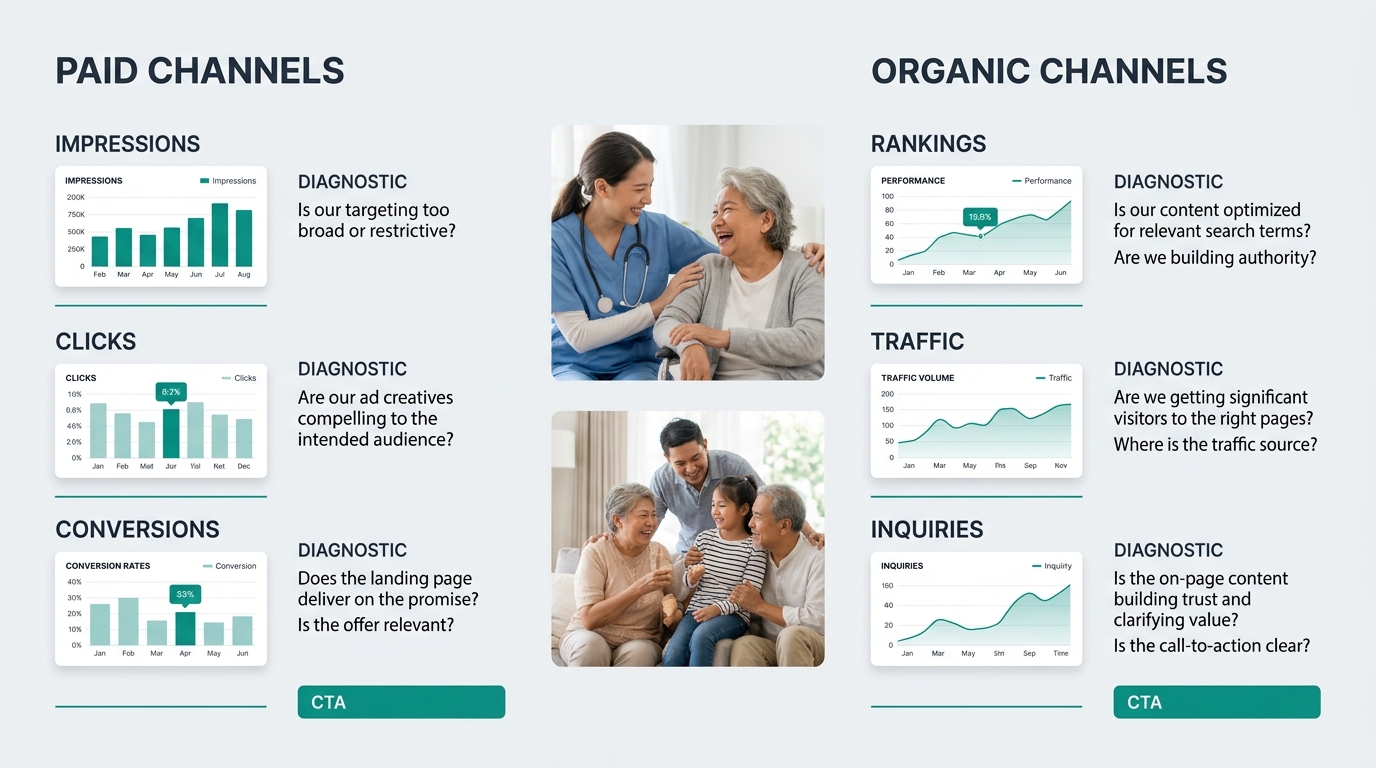
Paid channels and organic channels fail in different ways. The diagnostic process for each is distinct.
When PPC for home care stops producing leads, the troubleshooting sequence follows the money. Check impression share first (are your ads showing?), then click-through rate (are people clicking?), then landing page conversion rate (are clickers calling?). A cost per lead above $120 for home care keywords usually signals that your ad targeting is too broad or your landing page doesn’t match the search intent behind the keyword.
Organic failures are slower and harder to spot. A drop in home care SEO rankings can take 30 to 60 days to show up in your inquiry numbers, because cached rankings and existing bookmarks mask the decline. Cardinal Digital Marketing’s healthcare marketing audit framework identifies six strategic checkpoints for evaluating marketing programs, including capacity alignment, measurement infrastructure, and AI visibility. If your last SEO audit was more than six months ago, start there.
Don’t overlook reputation management for home care either. A sudden drop in your inquiry-to-consultation rate (Layer 2) sometimes traces back to new negative reviews that families see after finding you but before calling. Check your Google and Yelp profiles for anything posted in the last 30 days.
Tip: When referral volume is stable and ad spend is consistent but leads still dropped, audit your online reviews. Families research agencies before calling. Even 1 or 2 recent negative reviews can suppress conversion rates by 15% to 25%.
Questions the Numbers Still Can’t Answer
Data tells you where the funnel leaks. It doesn’t tell you why a discharge planner stopped returning your calls, why a family chose a competitor after visiting your website, or what your caregivers say about working for you when they talk to friends. Those answers live in conversations, not dashboards.
The best lead generation troubleshooting combines quantitative diagnostics with qualitative investigation. Call three referral partners who went quiet. Ask a family who didn’t convert what changed their mind. Talk to your intake coordinator about the calls that don’t turn into consultations.
Numbers identify the layer. People explain the problem. A complete home care marketing audit uses both. Agencies that commit to running this diagnostic process quarterly catch stalls in their early stages, before a slow month turns into a slow quarter and a slow quarter becomes a budget crisis.